When it comes to writing data to Elasticsearch, the first thing that comes to mind must be Logstash. Logstash is accepted by the majority of users because of its simplicity, scalability, and scalability. However, the ruler is shorter and the inch is longer, and Logstash must have application scenarios that it cannot apply to, such as:
- Massive data ETL
- Massive data aggregation
- Multi-source data processing
In order to meet these scenarios, many students will choose Spark, use Spark operators to process data, and finally write the processing results to Elasticsearch.
Our department used Spark to analyze Nginx logs, counted our web service access, aggregated Nginx logs every minute and finally wrote the results to Elasticsearch, and then used Kibana to configure real-time monitoring of the Dashboard. Both Elasticsearch and Kibana are convenient and practical, but with more and more similar requirements, how to quickly write data to Elasticsearch through Spark has become a big problem for us.
Today, I would like to recommend a black technology Seatunnel https://github.com/apache/incubator-seatunnel that can realize fast data writing. It is very easy to use , a high-performance, real-time data processing product that can deal with massive data. It is built on Spark and is easy to use, flexibly configured, and requires no development.
Kafka to Elasticsearch
Like Logstash, Seatunnel also supports multiple types of data input. Here we take the most common Kakfa as the input source as an example to explain how to use Seatunnel to quickly write data to Elasticsearch
Log Sample
The original log format is as follows:
127.0.0.1 elasticsearch.cn 114.250.140.241 0.001s "127.0.0.1:80" [26/Oct/2018:21:54:32 +0800] "GET /article HTTP/1.1" 200 123 "-" - "Dalvik/2.1.0 (Linux; U; Android 7.1.1; OPPO R11 Build/NMF26X)"
Elasticsearch Document
We want to count the visits of each domain name in one minute. The aggregated data has the following fields:
domain String
hostname String
status int
datetime String
count int
Seatunnel with Elasticsearch
Next, I will introduce you in detail, how we read the data in Kafka through Seatunnel, parse and aggregate the data, and finally write the processing results into Elasticsearch.
Seatunnel
Seatunnel also has a very rich plug-in that supports reading data from Kafka, HDFS, Hive, performing various data processing, and converting the results Write to Elasticsearch, Kudu or Kafka.
Prerequisites
First of all, we need to install seatunnel, the installation is very simple, no need to configure system environment variables
- Prepare the Spark environment
- Install Seatunnel
- Configure Seatunnel
The following are simple steps, the specific installation can refer to Quick Start
cd /usr/local
wget https://archive.apache.org/dist/spark/spark-2.2.0/spark-2.2.0-bin-hadoop2.7.tgz
tar -xvf https://archive.apache.org/dist/spark/spark-2.2.0/spark-2.2.0-bin-hadoop2.7.tgz
wget https://github.com/InterestingLab/seatunnel/releases/download/v1.1.1/seatunnel-1.1.1.zip
unzip seatunnel-1.1.1.zip
cd seatunnel-1.1.1

vim config/seatunnel-env.sh
# Specify the Spark installation path
SPARK_HOME=${SPARK_HOME:-/usr/local/spark-2.2.0-bin-hadoop2.7}
Seatunnel Pipeline
Like Logstash, we only need to write a configuration file of Seatunnel Pipeline to complete the data import. I believe that friends who know Logstash can start Seatunnel configuration soon.
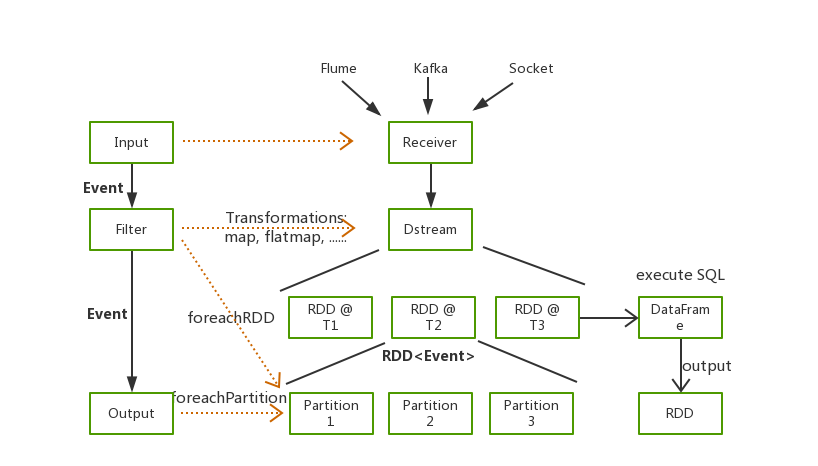
The configuration file includes four parts, namely Spark, Input, filter and Output.
Spark
This part is the related configuration of Spark, which mainly configures the resource size required for Spark execution.
spark {
  spark.app.name = "seatunnel"
  spark.executor.instances = 2
  spark.executor.cores = 1
  spark.executor.memory = "1g"
  spark.streaming.batchDuration = 5
}
Input
This part defines the data source. The following is a configuration example of reading data from Kafka,
kafkaStream {
    topics = "seatunnel-es"
    consumer.bootstrap.servers = "localhost:9092"
    consumer.group.id = "seatunnel_es_group"
    consumer.rebalance.max.retries = 100
}
Filter
In the Filter section, here we configure a series of conversions, including regular parsing to split logs, time conversion to convert HTTPDATE to a date format supported by Elasticsearch, type conversion for fields of type Number, and data aggregation through SQL
filter {
    # Parse the original log using regex
    # The initial data is in the raw_message field
    grok {
        source_field = "raw_message"
        pattern = '%{NOTSPACE:hostname}\\s%{NOTSPACE:domain}\\s%{IP:remote_addr}\\s%{NUMBER:request_time}s\\s\"%{DATA:upstream_ip}\"\\s\\[%{HTTPDATE:timestamp}\\]\\s\"%{NOTSPACE:method}\\s%{DATA:url}\\s%{NOTSPACE:http_ver}\"\\s%{NUMBER:status}\\s%{NUMBER:body_bytes_send}\\s%{DATA:referer}\\s%{NOTSPACE:cookie_info}\\s\"%{DATA:user_agent}'
   }
    # Convert data in "dd/MMM/yyyy:HH:mm:ss Z" format to
    # format supported in Elasticsearch
    date {
        source_field = "timestamp"
        target_field = "datetime"
        source_time_format = "dd/MMM/yyyy:HH:mm:ss Z"
        target_time_format = "yyyy-MM-dd'T'HH:mm:ss.SSS+08:00"
    }
    ## Aggregate data with SQL
    sql {
        table_name = "access_log"
        sql = "select domain, hostname, int(status), datetime, count(*) from access_log group by domain, hostname, status, datetime"
    }
 }
Output
Finally, we write the processed structured data to Elasticsearch.
output {
    elasticsearch {
        hosts = ["localhost:9200"]
        index = "seatunnel-${now}"
        es.batch.size.entries = 100000
        index_time_format = "yyyy.MM.dd"
    }
}
Running Seatunnel
We combine the above four-part configuration into our configuration file config/batch.conf.
vim config/batch.conf
spark {
  spark.app.name = "seatunnel"
  spark.executor.instances = 2
  spark.executor.cores = 1
  spark.executor.memory = "1g"
  spark.streaming.batchDuration = 5
}
input {
    kafkaStream {
        topics = "seatunnel-es"
        consumer.bootstrap.servers = "localhost:9092"
        consumer.group.id = "seatunnel_es_group"
        consumer.rebalance.max.retries = 100
    }
}
filter {
    # Parse the original log using regex
    # The initial data is in the raw_message field
    grok {
        source_field = "raw_message"
        pattern = '%{IP:hostname}\\s%{NOTSPACE:domain}\\s%{IP:remote_addr}\\s%{NUMBER:request_time}s\\s\"%{DATA:upstream_ip}\"\\s\\[%{HTTPDATE:timestamp}\\]\\s\"%{NOTSPACE:method}\\s%{DATA:url}\\s%{NOTSPACE:http_ver}\"\\s%{NUMBER:status}\\s%{NUMBER:body_bytes_send}\\s%{DATA:referer}\\s%{NOTSPACE:cookie_info}\\s\"%{DATA:user_agent}'
   }
    # Convert data in "dd/MMM/yyyy:HH:mm:ss Z" format to
    # format supported in Elasticsearch
    date {
        source_field = "timestamp"
        target_field = "datetime"
        source_time_format = "dd/MMM/yyyy:HH:mm:ss Z"
        target_time_format = "yyyy-MM-dd'T'HH:mm:00.SSS+08:00"
    }
    ## Aggregate data with SQL
    sql {
        table_name = "access_log"
        sql = "select domain, hostname, status, datetime, count(*) from access_log group by domain, hostname, status, datetime"
    }
 }
output {
    elasticsearch {
        hosts = ["localhost:9200"]
        index = "seatunnel-${now}"
        es.batch.size.entries = 100000
        index_time_format = "yyyy.MM.dd"
    }
}
Execute the command, specify the configuration file, and run Seatunnel to write data to Elasticsearch. Here we take the local mode as an example.
./bin/start-seatunnel.sh --config config/batch.conf -e client -m 'local[2]'
Finally, the data written into Elasticsearch is as follows, and with Kibana, real-time monitoring of web services can be realized ^_^.
"_source": {
    "domain": "elasticsearch.cn",
    "hostname": "localhost",
    "status": "200",
    "datetime": "2018-11-26T21:54:00.000+08:00",
    "count": 26
  }
Conclusion
In this post, we introduced how to write data from Kafka to Elasticsearch via Seatunnel. You can quickly run a Spark Application with only one configuration file, complete data processing and writing, and do not need to write any code, which is very simple.
When there are scenarios that Logstash cannot support or the performance of Logstah cannot meet expectations during data processing, you can try to use Seatunnel to solve the problem.
If you want to know more functions and cases of using Seatunnel in combination with Elasticsearch, Kafka and Hadoop, you can go directly to the official website https://seatunnel.apache.org/
We will publish another article "How to Use Spark and Elasticsearch for Interactive Data Analysis" in the near future, so stay tuned.
Contract us
- Mailing list : dev@seatunnel.apache.org. Send anything to
dev-subscribe@seatunnel.apache.organd subscribe to the mailing list according to the replies. - Slack: Send a
Request to join SeaTunnel slackemail to the mailing list (dev@seatunnel.apache.org), and we will invite you to join (please make sure you are registered with Slack before doing so). - bilibili B station video